Blog
Those of us old enough to remember the “good old days” recall that grade school focused on learning the 3 R’s: reading, ‘riting, and ‘rithametic. In the world of sensors, there are also 3 R’s: Repeatability, Resolution, and Response. As important as these sensor parameters are, there is often confusion in the mind of users about exactly what they mean and in what ways they tend to interact with each other. This article attempts to explain these 3 R’s for position sensors and to dispel any confusion that exists.
DEFINITIONS
Repeatability is a measure of the variation between outputs of a sensor-based measuring system for repeated trials of an identical mechanical input in a constant environment. Common practice is to use at least 3 repeated inputs, but 5 or more identical inputs are considered to be an even better sample for determining this parameter. Repeatability is usually evaluated by applying an averaging process to the variations in output values observed for the multiple trials. It is typically specified as a percentage of Full Scale Output or Full Span Output (FSO), but sometimes it is specified in absolute terms such as parts per million or fractions of the mechanical units applicable to the actual sensor-based measurement.
A constraint on repeatability measurement is that the trial inputs have to be applied in the same way, usually from a lower value to higher value, to eliminate any effects from hysteresis. Hysteresis error is a measure of the difference in system output when the mechanical input is rising up to the desired input value from a lower value compared to an identical input coming down from a higher input value to the desired value. For most contactless position sensors, hysteresis error is smaller than repeatability error.
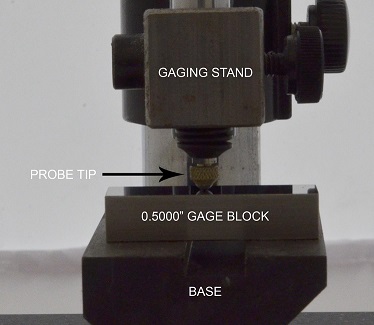
An example demonstrating repeatability can be seen in Figure 1, which shows a spring-loaded position sensor in a typical gaging stand being calibrated with a precision gage block of 0.5000 inch dimension. The sensor delivers an output of 0 to 10 Volts DC full scale for 0 to 1 inch of probe movement. The tip of the sensor is moved inward to allow the gage block to be inserted between the tip and a flat base, and then released to contact the block. In 5 trials, system outputs are: 5.0012, 5.0016, 5.0013, 5.0010, and 5.0015 Volts DC. The average value is slightly over 5.0013 Volts and the maximum variance is ±0.0003 Volts, which is equal to ±30 ppm of FSO, or 0.003% of FSO.
Resolution is a measure of the smallest change in the input to a sensor-based measuring system that will produce a measurable change in the electrical output from that system. While this may seem like a fairly simple concept, it is impacted by factors external to the sensor itself, the most significant of which is the signal-to-noise ratio of the system's analog output. Electrical noise present on the system's output can reduce the effective resolution of the system by masking any small changes in the sensor's output. For example, if the sensor's resolution specification is 0.25 mV, but the system output noise and ripple is 2 mVp-p, clearly sensor output changes smaller than 2 mV will not be discernable within that noise. Thus, the actual system resolution is only about 12% of what the sensor resolution specification offers.
Like repeatability, resolution is often specified as a percentage of Full Scale/Full Span Output (FSO) but may also be specified in absolute terms like fractions of the units of the actual sensor measurement, or, in digitally-augmented measurements, in bits, which is just a fractional measure expressed in powers of 2, as found in computers. Thus 10-bit resolution is 1 part in 1024 (210), 12-bit is 1 part in 4096 (212), etc.
Response denotes a sensor-based measuring system's performance under dynamic input conditions, that is, when the system's mechanical input is changing rapidly. It is particularly important to recognize that response is a measuring system parameter, not merely a sensor parameter or specification.
In practice, there are several ways to characterize response, typically based on whether the system is a first order or second order system. Traditional analog systems have used Bode plots to show frequency response and phase lag for repetitive inputs. For step function response, three times the system time constant is a typical measure of dynamic performance. In digital sampling systems, the update rate for a specified number of bits is one of the preferred measures of response. Regardless of the choice of how to specify response, the ultimate purpose is to understand how well the measuring system can respond to a changing input before the system's output becomes inaccurate, unusable, or unstable.
INTERACTIONS
From the foregoing definitions, it is easy to see that a system's repeatability could easily be affected by its resolution. If the measuring system's resolution is inadequate, it would likely be a significant limiting factor to excellent measurement system repeatability. In practice, sensor repeatability may be excellent, but measuring system repeatability cannot be any better than that permitted by the system's resolution.
While the interaction of repeatability with resolution in a measuring system is pretty easily understood, the interactions of resolution and response are not so straightforward. When the system's mechanical input is changing rapidly, the effects of resolution on system output are usually masked by the larger effects of decreased system output due to limitations imposed by the system's dynamic response. But if the mechanical input to a position measuring system changes slowly or intermittently, especially in a jerky way, then the effects of stiction (static friction) come into play.
Typically the effects of stiction in position measuring systems can be non-linear and are often not very repeatable, so determining or characterizing system resolution can be much more complicated, if even possible. And because the system resolution interacts with system repeatability, as was noted above, measurement errors can increase substantially, particularly if the system is providing position feedback for closed-loop control. Of course, any effects caused by stiction will also appear as non-linearity in the sensor's output. But because stiction effects are not very repeatable, digital linearization techniques to offset the non-linear effects will not be practical.
For this reason, efforts to reduce stiction are usually necessary to minimize any measurement errors caused by stiction in very slow-moving or intermittent-motion positioning systems. These efforts can involve applying techniques such as "dither", a low amplitude signal of high frequency that is input into the system to supplant stiction with much reduced dynamic friction, or by decreasing friction on the moving surfaces of the sensor by improving their surface finishes and by coating them with a lubricant.